Saturday, December 30, 2023

Topics for discussion during a Sprint Retrospective

 Definition of done

Discussing the "Definition of Done" (DoD) during the Sprint Retrospective is essential for the continuous improvement of the Scrum team. The DoD serves as a crucial agreement on the criteria that must be met for a user story or task to be considered complete. By revisiting and discussing the DoD in the retrospective, the team has an opportunity to reflect on whether the agreed-upon standards were consistently met during the sprint. This discussion allows the team to identify any deviations, challenges, or areas of improvement related to the DoD. Addressing these issues ensures that the team maintains a shared understanding of quality expectations and collectively works towards refining and adhering to the DoD in future sprints. Regularly revisiting and refining the Definition of Done contributes to the overall effectiveness of the development process, leading to higher-quality deliverables and increased customer satisfaction.

Team relations

Examining team relations during the Sprint Retrospective holds paramount importance in nurturing a healthy and collaborative working environment. Openly discussing team relations allows team members to address any interpersonal challenges, fostering improved communication and mutual understanding. By exploring dynamics within the team, the retrospective provides an opportunity to identify and resolve conflicts, enhance collaboration, and reinforce a positive team culture. Addressing team relations during the retrospective promotes a sense of transparency and trust, empowering team members to express concerns, share perspectives, and collectively work towards building strong, cohesive relationships. This emphasis on interpersonal dynamics contributes not only to the team's well-being but also to its overall productivity and success in future sprints.

In conclusion, the discussions around the "Definition of Done" (DoD) and "Team Relations" during the Sprint Retrospective are pivotal elements for the continuous improvement and success of a Scrum team. Revisiting and refining the DoD ensures a shared understanding of quality standards, promoting the consistent delivery of high-quality increments. Simultaneously, addressing team relations fosters a collaborative and positive working environment. Open communication about interpersonal dynamics helps identify and resolve conflicts, strengthening team bonds and contributing to a healthier team culture. Together, these discussions empower the team to enhance both the technical and interpersonal aspects of their work, paving the way for sustained improvements and a more effective Scrum framework in future sprints.

Approach for Scrum Teams in order to produce valuable increments

Each Scrum Member works only as an independent layer of the system

In a Scrum framework, each team member functions as an independent layer within the system, contributing specialized skills and expertise to the collective goal. This approach aligns with the principles of self-organization, where individuals take ownership of their responsibilities and collaborate seamlessly with others. As independent layers, team members bring unique perspectives and strengths to the project, fostering a dynamic and diverse environment. This structure not only encourages autonomy but also promotes accountability, ensuring that each layer actively contributes to the overall success of the Scrum team. By embracing the idea of individual autonomy within a coordinated framework, Scrum teams can enhance creativity, efficiency, and the overall adaptability of the development process.

Techniques to Navigate a Surge in Impediments for Scrum Teams

A Scrum Team is experiencing a growing list of impediments. Which techniques would be most helpful in this situation?

As a Scrum Team, prioritize the list and work on them in order.

In order to maintain focus and address impediments effectively, a Scrum team must prioritize its list of obstacles and tackle them in a systematic order. Prioritization allows the team to identify and resolve the most critical impediments first, ensuring that they have the maximum impact on improving the overall workflow. By systematically addressing impediments in order of priority, the team can streamline its processes, enhance collaboration, and maintain a sustainable pace of work. This approach not only facilitates a more efficient development cycle but also fosters a culture of continuous improvement, as the team remains responsive to emerging challenges and actively seeks solutions to create a smoother and more productive work environment.

The Scrum Master discusses the impediments with the Scrum Team.

The Scrum Master plays a pivotal role in facilitating effective communication within the Scrum Team, especially when it comes to addressing impediments. Regular discussions between the Scrum Master and the team about impediments are crucial for maintaining transparency and swiftly resolving issues. By fostering an open and collaborative environment, the Scrum Master encourages team members to share their concerns and challenges. These discussions serve as a platform for identifying impediments, understanding their impact on the team's progress, and collectively devising strategies for their resolution. The Scrum Master's role extends beyond obstacle removal, encompassing mentorship and guidance, ensuring that the entire team is aligned and empowered to overcome impediments and optimize their workflow.

Typical location for the Node.js in cPanel

let's assume a node.js developer has an account called "user" on your whm server and they followed the cpanel guide to creating a test node.js application. where would you find the node.js test script?

In a cPanel environment, when a user sets up a Node.js application following the cPanel guide, the typical location for the Node.js application script or entry point is within the user's home directory. Specifically, you would commonly find it in the public_html directory or a subdirectory within public_html.

Here is a general path structure:
/home/user/public_html/your_nodejs_app/

Within the specified directory (your_nodejs_app/ in this example), you should find the main script file, often named app.js or server.js, or another file specified as the entry point in the package.json file.

If the user has followed the cPanel guide accurately, the exact path and name of the script file would depend on their choices during the setup process.

Additionally, cPanel might provide specific interfaces or tools for managing and configuring Node.js applications. You may want to check the cPanel interface for sections related to Node.js, where users can configure and manage their Node.js applications. The script's location and details are often specified during the setup process or can be managed through the cPanel interface.

What are two effective ways for a scrum team to ensure security concerns are satisfied?

Ensuring security concerns are addressed effectively is paramount for any Scrum team operating in today's digital landscape. As organizations increasingly rely on agile methodologies like Scrum to deliver software solutions quickly and iteratively, integrating robust security measures becomes a critical aspect of the development process. In this article, we explore two effective strategies that Scrum teams can employ to ensure that security concerns are thoroughly addressed and satisfied throughout the software development lifecycle. Here are two effective ways for a Scrum team to ensure security concerns are satisfied:

Include Security Considerations in Definition of Done (DoD)

  • The Definition of Done is a key concept in Scrum, defining the criteria that must be met for a product backlog item to be considered complete.
  • Ensure that security requirements are explicitly included in the Definition of Done. This may involve security testing, code reviews specifically focused on security, and compliance checks.
  • Encourage collaboration between development and security teams to establish clear security acceptance criteria for each user story or task. These criteria should be part of the Definition of Done and should cover aspects such as data encryption, authentication mechanisms, and vulnerability testing.

Integrate Security into the Development Process

  • Implement security practices throughout the entire development lifecycle, integrating them into the Scrum process rather than treating security as a separate phase.
  • Conduct regular security training for team members to raise awareness about potential security risks and best practices. This helps in building a security-conscious culture within the team.
  • Integrate automated security testing tools into the CI/CD (Continuous Integration/Continuous Deployment) pipeline. Automated tools can help identify vulnerabilities early in the development process, allowing the team to address them before they become more difficult and costly to fix.


By incorporating security into the Definition of Done and integrating security practices into the development process, a Scrum team can proactively address security concerns and produce a more secure product. Additionally, maintaining open communication and collaboration between development and security teams is essential for identifying and resolving security issues effectively.

Friday, December 08, 2023

MS SQL Database Maintenance

Database maintenance tasks in Microsoft SQL Server are essential for ensuring optimal performance, data integrity, and overall health of the database system. Here are some key maintenance tasks and steps to perform them:

  1. Backup the Database:
    • Step 1: Use SQL Server Management Studio (SSMS) or T-SQL commands to perform a full database backup.
    • Step 2: Schedule regular backups, considering the database size, recovery model, and business requirements.

      BACKUP DATABASE [YourDatabase] TO DISK = 'C:\Backup\YourDatabase.bak'

  2. Check Database Integrity:
    • Step 1: Use the DBCC CHECKDB command to check the logical and physical integrity of the database.
    • Step 2: Schedule regular integrity checks to identify and fix any issues.

    DBCC CHECKDB('YourDatabase')

  3. Update Database Statistics:
    • Step 1: Regularly update statistics to help the query optimizer generate efficient execution plans.
    • Step 2: Use the UPDATE STATISTICS command or enable the Auto Update Statistics option.

    UPDATE STATISTICS TableName

  4. Index Maintenance:
    • Step 1: Rebuild or reorganize fragmented indexes to improve query performance.
    • Step 2: Monitor index usage and consider removing unnecessary indexes.

    ALTER INDEX ALL ON TableName REBUILD;

  5. Clean up Database:
    • Step 1: Identify and remove obsolete data or records that are no longer needed.
    • Step 2: Archive or purge old data to free up space and improve performance.
  6. Monitor Disk Space:
    • Step 1: Regularly monitor disk space usage for database files.
    • Step 2: Resize files, add additional filegroups, or add data files as needed.

    ALTER DATABASE [YourDatabase] MODIFY FILE (NAME = 'YourDataFile', SIZE = xxxMB);

  7. Review and Optimize Queries:
    • Step 1: Regularly review and optimize high-cost queries.
    • Step 2: Use tools like SQL Server Profiler or Query Store to identify poorly performing queries.
  8. Scheduled Maintenance Plans:
    • Step 1: Utilize SQL Server Maintenance Plans to automate common maintenance tasks.
    • Step 2: Configure plans to include tasks like backup, integrity checks, and index maintenance.
  9. Update SQL Server and Apply Service Packs/Cumulative Updates:
    • Step 1: Regularly check for updates and patches from Microsoft.
    • Step 2: Apply the latest service packs and cumulative updates to keep SQL Server up to date.
  10. Review and Set Database Options:
    • Step 1: Review and set database options based on best practices and business requirements.
    • Step 2: Adjust settings such as recovery model, compatibility level, and file growth.
  11. Security Auditing and Compliance:
    • Step 1: Regularly review and audit security settings and permissions.
    • Step 2: Ensure compliance with organizational security policies and industry standards.
  12. Monitor and Optimize TempDB:
    • Step 1: Regularly monitor TempDB usage and performance.
    • Step 2: Adjust TempDB file configuration and size based on workload.

    ALTER DATABASE tempdb MODIFY FILE (NAME = 'tempdev', SIZE = xxxMB);

  13. Health Check and Performance Tuning:
    • Step 1: Conduct regular health checks to identify performance bottlenecks.
    • Step 2: Use tools like SQL Server Management Studio, SQL Server Profiler, and Dynamic Management Views (DMVs) for analysis.
  14. Database Documentation:
    • Step 1: Maintain up-to-date documentation for the database schema, objects, and maintenance procedures.
    • Step 2: Document changes, updates, and configurations.
  15. Database Replication and Mirroring (if applicable):
    • Step 1: Monitor and maintain database replication or mirroring configurations.
    • Step 2: Address any issues related to high availability configurations.
     

 Note:
    Always perform these tasks during scheduled maintenance windows to minimize the impact on users.
    Before making significant changes, it's advisable to test them in a non-production environment.
    Regularly review SQL Server logs and error messages for potential issues.

Remember that the specifics of each task may vary based on your specific SQL Server version, edition, and business requirements. Always refer to the official Microsoft SQL Server documentation for the most accurate and up-to-date information.

How to Measure Throughput of an Application

Measuring the throughput of an application helps assess its ability to handle a certain volume of transactions or data within a given time frame. Here are several methods to measure the throughput of an application:

  1. Load Testing Tools
    Use load testing tools like Apache JMeter, Gatling, or locust.io to simulate multiple users or transactions accessing the application simultaneously.
    These tools provide metrics such as transactions per second, requests per second, and overall throughput under different load conditions.
  2. Application Performance Monitoring (APM) Tools
    APM tools, such as New Relic, AppDynamics, or Dynatrace, often include features to monitor application throughput in real-time.
    These tools provide insights into transaction rates and overall system throughput.
  3. Logging and Metrics
    Instrument your application with logging statements or metrics that record the start and end times of transactions or operations.
    Analyze the logs or metrics to calculate throughput over specific intervals.
  4. Real User Monitoring (RUM)
    RUM tools, like Google Analytics or New Relic Browser, can provide insights into the user interactions with your application and help assess overall user throughput.
  5. Network Monitoring Tools
    Use network monitoring tools to analyze network traffic and identify the volume of data being transmitted between different components of your application.
    Tools like Wireshark or tcpdump can capture and analyze network packets.
  6. Database Monitoring
    Monitor database throughput by analyzing metrics such as transactions per second, queries per second, or data transfer rates.
    Database management systems often provide tools or interfaces for monitoring these metrics.
  7. API Testing Tools
    If your application includes APIs, tools like Postman or SoapUI can be used to send a large number of requests and measure the throughput of the APIs.
  8. Custom Scripts and Automation
    Develop custom scripts or automation to interact with your application in a controlled manner, measuring the throughput of specific functionalities or transactions.
  9. System Resource Monitoring
    Monitor system resources such as CPU usage, memory utilization, and disk I/O to understand how resource constraints may impact overall application throughput.
  10. Benchmarking
    Conduct benchmarking tests to evaluate the application's performance under various conditions.
    Assess throughput under different user loads, data volumes, or concurrent transaction scenarios.

When measuring throughput, consider the specific transactions, data transfers, or operations that are critical to your application. Also, perform measurements under various scenarios to understand how the application handles different levels of load and usage.

How to Measure The Response Time of an Application

Measuring the response time of an application is a critical aspect of assessing its performance and user experience. In this article, we will explore the various methods and tools available to accurately measure the response time of an application. Whether you're a developer, a quality assurance engineer, or an IT professional responsible for monitoring application performance, understanding how to measure response time effectively is key to ensuring optimal functionality and user satisfaction.

Following are several ways you can measure the response time of an application.

  1. Manual Testing
    Stopwatch or Timer Manually measure the time it takes for the application to respond to a specific action or request using a stopwatch or timer. This method is suitable for quick, informal assessments.
  2. Browser Developer Tools
    Network Tab Most modern web browsers come with built-in developer tools that include a "Network" tab. You can use this tab to monitor the loading times of various resources, including those requested by your application.
  3. Automated Testing Tools
    Load Testing Tools Tools like Apache JMeter, Gatling, or locust.io can simulate multiple users accessing an application simultaneously. These tools provide metrics such as response time under various load conditions.
  4. Application Performance Monitoring (APM) Tools
    APM tools, such as New Relic, AppDynamics, or Dynatrace, are designed to monitor the performance of applications in real-time. They can provide detailed insights into response times, transaction traces, and the performance of various components.
  5. Code Instrumentation
    Manual Instrumentation Introduce logging statements or timers in the application's code to track the time it takes for specific operations to complete. This approach requires modifying the code and is often used during development or troubleshooting.
  6. API Testing Tools
    If your application has APIs, tools like Postman or SoapUI can be used to send requests and measure the response time of the API endpoints.
  7. Real User Monitoring (RUM)
    RUM tools, like Google Analytics or New Relic Browser, collect performance data from real users accessing your application. They provide insights into how actual users experience the application.
  8. Synthetic Monitoring
    Use synthetic monitoring tools to simulate user interactions with your application from various locations. These tools, like Pingdom or UptimeRobot, can provide response time metrics from different geographic locations.
  9. Custom Scripts and Automation
    Develop custom scripts or automation to interact with your application and measure response times. This approach is flexible and can be tailored to specific user scenarios.

When measuring response time, it's essential to consider different aspects such as page load time, transaction response time, server response time, and network latency. Additionally, perform measurements under various scenarios, including peak usage times and different user interactions, to get a comprehensive understanding of your application's performance.

Preventive Maintenance Task for Applications

Preventive maintenance for applications is essential to ensure the continued availability, performance, and security of the software. Here are some tasks that are typically carried out as part of the preventive maintenance process for an application:

     
  1. Regular Updates and Patching
    Keep the application up to date with the latest software updates, patches, and bug fixes.
    Ensure that security updates are applied promptly to protect against vulnerabilities.
  2. Backup and Restore Testing
    Implement a regular backup strategy for critical application data.
    Test the backup and restore procedures periodically to ensure data recoverability.
  3. Performance Monitoring
    Monitor the application's performance metrics, such as response times, throughput, and resource utilization.
    Identify and address performance issues to maintain optimal user experience.
  4. Database Maintenance
    Regularly optimize and maintain the database associated with the application.
    Clean up unnecessary data, defragment indexes, and update statistics for better performance.
  5. Security Audits and Vulnerability Assessments
    Conduct regular security audits to identify and address potential vulnerabilities.
    Perform vulnerability assessments to discover and remediate security weaknesses.
  6. User Account Management
    Review and manage user accounts and permissions regularly.
    Disable or remove inactive or unnecessary user accounts to enhance security.
  7. Logging and Monitoring
    Implement robust logging mechanisms within the application.
    Regularly review logs for errors, warnings, and unusual activities.
    Set up alerts for critical events.
  8. License Management
    Ensure that the application is properly licensed and compliant with licensing agreements.
    Keep track of license renewals and updates.
  9. Documentation Update
    Keep documentation, including user manuals and technical documentation, up to date.
    Document any changes, updates, or configurations made during preventive maintenance.
  10. Disaster Recovery Planning
    Review and update the disaster recovery plan for the application.
    Test the effectiveness of the disaster recovery plan through simulated scenarios.
  11. Testing and Quality Assurance
    Conduct regular testing, including functional testing, performance testing, and security testing.
    Address any issues identified during testing promptly.
  12. Code Review and Optimization
    Periodically review the application code for best practices, security vulnerabilities, and performance bottlenecks.
    Optimize code for better performance and maintainability.
  13. Capacity Planning
    Monitor application usage trends and plan for future capacity needs.
    Ensure that the application infrastructure can handle increasing workloads.
  14. Training and Documentation for Users
    Provide training and documentation for end-users to ensure efficient and effective use of the application.
    Keep users informed about updates and changes.
  15. Integration and Compatibility Testing
    Test the application's compatibility with different operating systems, browsers, and third-party integrations.
    Ensure that updates or changes in other systems do not negatively impact the application.
  16. License and Compliance Checks
    Regularly check and ensure compliance with software licenses and third-party dependencies.
    Address any licensing issues promptly.

The specific tasks and frequency of preventive maintenance for an application may vary based on factors such as the application's criticality, complexity, and usage patterns. Regular maintenance helps prevent downtime, enhances security, and ensures that the application meets performance expectations.

Preventive Maintenance Task for a Server

Preventive maintenance is a cornerstone of ensuring the reliability, performance, and longevity of server systems in any IT environment. In this article, we will delve into the essential preventive maintenance tasks that are crucial for maintaining optimal server functionality. Whether you're managing a small business server or a large-scale enterprise infrastructure, implementing preventive maintenance tasks can help mitigate potential issues, minimize downtime, and optimize the overall performance of your server environment.

The following are the tasks that need to be carried out in carrying out preventive maintenance activities on the server.

  1. Regular Backup and Restore Testing
    Perform regular backups of critical data and configurations.
    Test the restoration process to ensure that data can be successfully recovered.
  2. Operating System Updates
    Regularly apply operating system updates, security patches, and service packs to keep the system up to date.
    Schedule maintenance windows to minimize disruption to services.
  3. Application and Software Updates
    Keep all installed applications and server software up to date with the latest patches and updates by doing Application Maintenance. Ensure that any third-party software or applications are also maintained regularly.
  4. Antivirus and Security Software Updates
    Update antivirus and security software to protect against new threats.
    Schedule regular system scans to detect and remove any potential threats.
  5. Hardware Inspection and Cleaning
    Physically inspect the server hardware for signs of wear, damage, or impending failure.
    Clean dust and debris from server components to prevent overheating.
  6. Storage Management
    Monitor and manage storage capacity to ensure that there is sufficient space for data and system files.
    Optimize storage configurations and consider archiving or deleting unnecessary data.
  7. Network Infrastructure Check
    Review and update network configurations, including firewall rules and security policies.
    Monitor network performance and address any bottlenecks or issues.
  8. Hardware and Software Performance Monitoring
    Use monitoring tools to track server performance metrics, such as CPU usage, memory utilization, and disk I/O.
    Identify and address performance bottlenecks before they impact service availability.
  9. Log File Review
    Regularly review system and application log files for error messages or signs of potential issues.
    Investigate and address any anomalies or warnings found in the logs.
  10. User Account Management
    Regularly review and update user accounts and permissions.
    Remove inactive or unnecessary user accounts and ensure that only authorized users have access.
  11. Disaster Recovery Planning
    Review and update the disaster recovery plan to ensure it reflects the current state of the server environment.
    Conduct periodic drills to test the effectiveness of the disaster recovery plan.
  12. Documentation Update
    Keep server documentation up to date, including network diagrams, hardware configurations, and software licenses.
    Document any changes or updates made during the preventive maintenance process.
  13. Performance Tuning
    Fine-tune server configurations based on changing workload requirements.
    Optimize server settings for better performance and resource utilization.
  14. Training and Awareness
    Ensure that IT staff responsible for server maintenance receive regular training on new technologies and best practices.
    Foster awareness of security best practices among all users.
  15. Regularly performing these preventive maintenance tasks helps minimize the risk of system failures, improves security, and ensures that the server environment remains efficient and reliable. The specific tasks and frequency may vary based on the organization's requirements and the nature of the server infrastructure.

How to Identify Windows services via command prompt

You can use various commands in the Command Prompt or PowerShell to find out which services are running on Windows. Here are a few common methods:

1. SC Command:

Open the Command Prompt.
To list all services:

sc query

2. Net Command:

Open the Command Prompt.
To list all services:

net start

3. PowerShell:

Open PowerShell.
To list all services:

Get-Service

To list running services:

Get-Service | Where-Object { $_.Status -eq 'Running' }

4. Tasklist and Task Manager:

Open the Command Prompt.
To list all running processes, including services:

tasklist

You can also use Task Manager by pressing Ctrl + Shift + Esc or Ctrl + Alt + Delete and selecting "Task Manager." In Task Manager, go to the "Services" tab to see a list of services and their status.

5. Services.msc:

Open the "Run" dialog (Win + R) and type services.msc.
This opens the Services management console, where you can see a list of all services, their status, and startup type.

6. System Configuration (msconfig):

Open the "Run" dialog (Win + R) and type msconfig.
 Go to the "Services" tab to see a list of services that start with the system.

How do I find out CPU utilization in Windows using the command prompt?

Understanding CPU utilization is crucial for monitoring system performance and identifying potential bottlenecks on a Windows system. In this article, we will explore the various commands and techniques available through the command prompt to check CPU utilization in Windows. Whether you're a system administrator, IT professional, or simply curious about your system's performance metrics, learning how to find out CPU utilization using the command prompt will provide you with valuable insights into your system's health and efficiency.  In Windows, you can find out CPU utilization using the command prompt with various commands. Here are a few commonly used commands:

Tasklist and Task Manager:

Open the Command Prompt.
To display a list of running processes and their CPU usage:

tasklist

You can also use Task Manager by pressing Ctrl + Shift + Esc or Ctrl + Alt + Delete and selecting "Task Manager." In Task Manager, go to the "Processes" or "Details" tab to see CPU usage.

WMIC (Windows Management Instrumentation Command-line):

Open the Command Prompt.
To display information about CPU usage:

wmic cpu get loadpercentage

Performance Monitor (perfmon):

Open the Command Prompt and run perfmon to open the Performance Monitor.
In the Performance Monitor, you can create a new Data Collector Set to collect performance data, including CPU usage.

PowerShell:

Open PowerShell.
To get information about CPU usage:

Get-WmiObject Win32_Processor | Select-Object LoadPercentage
 

Systeminfo:

Open the Command Prompt.
To display general system information, including the current CPU usage:

systeminfo


Task Manager and PowerShell Combined:

You can use PowerShell to query specific information from Task Manager:

Get-Process | Sort-Object CPU -Descending | Select-Object -First 5

These commands provide information about CPU utilization, including details on processes and their CPU usage. Choose the method that best fits your needs and preferences. Keep in mind that some commands may require administrative privileges to access certain information.

How to check Windows memory utilization via command prompt

In the world of Windows system administration and troubleshooting, monitoring memory utilization is a critical aspect of maintaining system performance and stability. In this article, we will delve into the methods and commands available via the command prompt to check Windows memory utilization. Whether you're a system administrator, IT professional, or simply a curious user wanting to understand how your system utilizes memory, learning how to check Windows memory utilization through the command prompt is a valuable skill that can help you optimize resource usage and diagnose potential issues effectively.

You can use the command prompt in Windows to find out memory utilization by utilizing various commands. Here are a few commonly used commands:

Tasklist:

Open the Command Prompt.
To display a list of running processes and their memory usage:

tasklist

Systeminfo:

Open the Command Prompt.
To display general system information, including total physical memory and available memory:

systeminfo

WMIC (Windows Management Instrumentation Command-line):

Open the Command Prompt.
To display information about available memory:

wmic memorychip get capacity

To display information about free and total physical memory:

wmic os get FreePhysicalMemory,TotalVisibleMemorySize

Task Manager (taskmgr):

Open Task Manager by pressing Ctrl + Shift + Esc or Ctrl + Alt + Delete and selecting "Task Manager."
Go to the "Performance" tab to see real-time information about CPU, memory, and other system resources.

Performance Monitor (perfmon):

Open the Command Prompt and run perfmon to open the Performance Monitor.
In the Performance Monitor, you can create a new Data Collector Set to collect performance data, including memory usage.

PowerShell:

Open PowerShell.
To get information about available memory:

Get-CimInstance -ClassName Win32_OperatingSystem | Select-Object FreePhysicalMemory

To get information about total and available memory:

Get-CimInstance -ClassName Win32_OperatingSystem | Select-Object TotalVisibleMemorySize, FreePhysicalMemory


These commands provide information about memory utilization, including details on total physical memory, free memory, and memory usage by processes. Choose the method that best fits your needs and preferences. Keep in mind that some commands may require administrative privileges to access certain information.

How to find out what processes are running on Windows?

Understanding the processes running on a Windows system is fundamental for troubleshooting, optimizing performance, and ensuring system security. In this article, we will explore various methods and tools available to identify and analyze the processes currently running on a Windows operating system. Whether you're a system administrator, IT professional, or an everyday user looking to gain insights into your system's activity, understanding how to find out what processes are running on Windows is a valuable skill.

In Windows, you can use various methods and tools to find out what processes are running. Here are some common approaches:

Task Manager:

Press Ctrl + Shift + Esc or Ctrl + Alt + Delete and select "Task Manager."
In Task Manager, go to the "Processes" or "Details" tab to see a list of running processes.
You can right-click on the column headers to add or remove columns, such as CPU usage, memory usage, etc.

Resource Monitor:

Open Task Manager and go to the "Performance" tab.
Click on "Open Resource Monitor" at the bottom.
In Resource Monitor, go to the "CPU," "Memory," or "Disk" tabs for detailed information about running processes.

Command Prompt (wmic):

Open Command Prompt or PowerShell.
To list all processes:

wmic process get caption,processid

To find a specific process by name:

wmic process where "name like '%process_name%'" get caption,processid

PowerShell:

Open PowerShell.
To list all processes:

Get-Process

To find a specific process by name:

Get-Process -Name "process_name"

Tasklist Command:

Open Command Prompt.
To list all processes:

tasklist

To find a specific process by name:

tasklist | find "process_name"


System Configuration (msconfig):

Open the "Run" dialog (Win + R) and type msconfig.
Go to the "Services" or "Startup" tab to see processes that run at system startup.

Process Explorer:

Download and run "Process Explorer" from the official Microsoft website.
This tool provides a more detailed view of processes, including open handles and DLLs.

In conclusion, having the ability to identify and analyze the processes running on a Windows system is essential for maintaining system stability, performance, and security. By using the methods and tools discussed in this article, users can gain valuable insights into their system's activity, detect potential issues or resource bottlenecks, and take necessary actions to optimize and troubleshoot effectively. Whether it's monitoring for suspicious processes, optimizing resource utilization, or diagnosing performance issues, a comprehensive understanding of Windows processes empowers users to make informed decisions and ensure the smooth operation of their systems.

How to find out what processes are running on Linux?

You can use various commands to find out what processes are running on Linux. Here are some commonly used commands:

ps Command:

The ps command provides a snapshot of the current processes. You can use it in different ways to display various levels of information.

To display a list of running processes:

ps aux

To display a tree-like process hierarchy:

ps auxf

top Command:

The top command provides a dynamic, real-time view of system processes, including details about CPU and memory usage.

top

Press 'q' to exit.

htop Command:

Similar to top, but with a more user-friendly interface. If it's not installed, you can install it using your package manager.

htop

Press 'q' to exit.

pgrep Command:

The pgrep command allows you to search for a process by name.

pgrep "process_name"

pkill Command:

The pkill command is used to send signals to processes based on their name.

pkill "process_name"

pstree Command:

The pstree command displays a tree diagram of processes.

pstree

System Monitor (GUI):

Many Linux distributions provide a graphical system monitor that displays running processes. For example, on GNOME-based systems:

gnome-system-monitor

On KDE-based systems, you might use ksysguard.

ps aux and grep:

You can use the combination of ps aux and grep to filter for specific processes.

ps aux | grep "process_name"

Replace "process_name" with the name or part of the name of the process you are looking for.

Choose the command that best suits your needs and provides the level of detail you require. The commands mentioned above provide information about the running processes, their PIDs (Process IDs), CPU and memory usage, and other details.

How do I find out the CPU and memory utilization of an application on Linux?

To find out the CPU and memory utilization of a specific application on Linux, you can use a combination of commands such as ps, top, or htop. Here are some approaches:

1. Using ps Command

The ps command provides information about processes. You can use it with options to filter information about a specific application.

ps aux | grep "application_name"

Replace "application_name" with the name or part of the name of your application. This will show you details about the application's process, including its PID (Process ID). You can then monitor its CPU and memory usage.

2. Using top or htop Command:

Both top and htop provide real-time information about system resources, including CPU and memory usage. You can launch them and then use their search or filtering features to locate the specific application.

For top:

top

Once in top, press 'O' to enter the filter option, and then enter the application name.

For htop:

htop

In htop, start typing the application name, and it will be filtered accordingly.


3. Using pidof and pmap Commands:

If you know the PID of the application, you can use pmap to display detailed information about the memory usage.

pidof application_name
pmap <pid>


Replace "application_name" with the name of your application, and <pid> with the actual Process ID you obtained from the pidof command.

4. Using pgrep and pmap Commands:

You can also use pgrep to find the PID and then use pmap:

pgrep -o "application_name"
pmap <pid>


Replace "application_name" with the name of your application and <pid> with the actual Process ID.

Choose the method that best fits your needs and preferences. These commands can help you monitor and analyze the resource utilization of a specific application on your Linux system.

How to find out CPU utilization in linux?

In Linux, you can find out CPU utilization using various commands. Here are a few commonly used commands:

top
The top command is an interactive process viewer that provides real-time information about system resources, including CPU utilization. Open a terminal and type:

top

Look for the CPU-related information at the top of the screen. Press 'q' to exit top.

htop
Similar to top, but with a more user-friendly interface, htop provides real-time information about system resources, including CPU usage. If it's not installed, you can install it using your package manager (e.g., sudo apt-get install htop on Debian/Ubuntu). Once installed, run:

htop

Navigate using arrow keys, and press 'q' to exit.

mpstat
The mpstat command is used for monitoring CPU usage. Open a terminal and type:

mpstat

This command provides detailed information about CPU usage, including percentages for each CPU core.

vmstat
The vmstat command reports information about processes, memory, paging, block IO, traps, and CPU activity. Open a terminal and type:

vmstat 1


This will display CPU statistics at regular intervals (every 1 second in this example). Press 'q' to exit.

sar
The sar command is part of the sysstat package and can be used for system activity reporting. To install sysstat and use sar, you might need to run:

sudo apt-get install sysstat   # For Debian/Ubuntu

Then, run:

sar -u 1

This will display CPU utilization at one-second intervals. Press 'q' to exit.

/proc/stat
The /proc/stat file contains information about CPU statistics. You can use commands like cat or grep to view its contents. For example:

cat /proc/stat

or

grep cpu /proc/stat

These commands will provide information about the current CPU utilization, load averages, and other related details. Choose the command that best fits your preference and system requirements.

How do I find out memory utilization in Linux?

In Linux, you can find out memory utilization using various commands. Here are a few commonly used commands:

free
The free command provides information about total, used, and free memory in kilobytes. Open a terminal and type:

free -m

This will display the memory usage in megabytes.

top
The top command is an interactive process viewer that provides real-time information about system resources, including memory utilization. Open a terminal and type:

top

Look for the memory-related information at the top of the screen. Press 'q' to exit top.

htop
Similar to top, but with a more user-friendly interface, htop provides real-time information about system resources, including memory usage. If it's not installed, you can install it using your package manager (e.g., sudo apt-get install htop on Debian/Ubuntu). Once installed, run:

htop

Navigate using arrow keys, and press 'q' to exit.

vmstat
The vmstat command reports information about processes, memory, paging, block IO, traps, and CPU activity. Open a terminal and type:

vmstat -s

This will display a summary of memory statistics.

/proc/meminfo:
The /proc/meminfo file contains detailed information about the system's memory usage. You can view its contents using commands like cat or grep. For example:

cat /proc/meminfo

or

grep MemTotal /proc/meminfo

The output of these commands will show you information about total, used, free, and cached memory, as well as other memory-related details. Keep in mind that the units may be displayed in kilobytes (KB) or megabytes (MB) depending on the command used.

"Good" utilization threshold for HDD

The acceptable threshold for hard disk drive (HDD) utilization, or disk usage, can vary based on the specific use case, the type of tasks performed on the system, and the total capacity of the disk. Here are some general guidelines:

Normal Desktop or Laptop Usage
For typical desktop or laptop use, a disk utilization below 80-90% is often considered good. This allows for some headroom for temporary files, updates, and system processes.

Servers and High-Performance Systems
In server environments or systems handling resource-intensive tasks, a lower threshold, such as 70-80%, might be considered to ensure optimal performance.

Regularly monitoring disk utilization and free space, along with addressing any warnings or alerts from the operating system or monitoring tools, is essential for maintaining system health.

To check disk utilization on Windows, you can use tools like Task Manager or File Explorer. On Linux or macOS, you can use commands like df -h in the terminal to display disk space usage. Additionally, there are various third-party disk monitoring tools available for more detailed analysis.

How To Check a Port on a Server is Open?

To determine if a port on a server is open, you can use various network tools and commands. Here are some common methods:

Telnet

On Windows, open the Command Prompt and use the following command: telnet server_ip port_number
On Linux or macOS, use the Terminal with the command: telnet server_ip port_number

If the port is open, you'll see a blank screen or a welcome message. If the port is closed or unreachable, you'll get an error message.

Example:
telnet example.com 80

Netcat (nc)

Netcat is a versatile networking tool. You can use it to check if a port is open. On Linux or macOS, use the Terminal with the command: nc -zv server_ip port_number

Example:
nc -zv example.com 80

If the port is open, you'll see a success message. If it's closed, you'll get an error.

PowerShell (Windows)

On Windows, you can use PowerShell to test a port.

Test-NetConnection -ComputerName server_ip -Port port_number

This command will provide information about the connection status, including whether the port is open.

Nmap

Nmap is a powerful network scanning tool that can be used to check for open ports.  On Linux, macOS, or Windows, use the Terminal or Command Prompt with the command: nmap -p port_number server_ip

Example:
nmap -p 80 example.com

Nmap provides detailed information about open ports and their status.

Always ensure that you have permission to check the port status on the target server, as unauthorized port scanning could be considered malicious activity.

These methods allow you to check the status of a specific port on a server and can be helpful in troubleshooting network connectivity issues.

Good Network Latency

Network latency, which is the time it takes for data to travel from the source to the destination, is crucial for the performance of networked applications. The acceptable level of latency depends on the specific application or use case, and what is considered "good" can vary widely. However, here are some general guidelines:

  • Gaming and Real-Time Applications: For online gaming, video conferencing, or other real-time applications, lower latency is crucial. Latency values below 50 milliseconds (ms) are generally considered good for these scenarios. Extremely low latency is often desired to provide a smooth and responsive user experience.
  • VoIP (Voice over Internet Protocol): VoIP calls are sensitive to latency. A latency of 150 ms or lower is often considered acceptable for clear voice communication. Higher latencies may result in noticeable delays and communication issues.
  • General Web Browsing: For general web browsing, latency values below 100 ms are typically acceptable. Users may start to notice delays when latencies exceed this threshold, leading to a perceptible lag in loading web pages.
  • File Transfers and Bulk Data Movement: Latency is also crucial for efficient file transfers and data synchronization. In these cases, latency values below 100 ms are generally acceptable, but the impact might depend on the volume of data being transferred.
  • Video Streaming: Video streaming services can tolerate higher latency compared to real-time applications. Latency values below 100 ms are often acceptable, but higher latencies may not be as noticeable during video playback.

It's important to note that these are general guidelines, and the specific requirements for acceptable latency can vary based on user expectations and the nature of the application. In certain industries, such as finance or online gaming, even lower latency values may be necessary.

Network monitoring tools can help assess and analyze network latency. If you're experiencing latency issues, it's essential to investigate the root cause, whether it's related to the network infrastructure, internet service provider (ISP), or other factors.

What is a Good Threshold for CPU & Memory Utilization?

CPU

There isn't a one-size-fits-all answer to what constitutes a "good condition" for CPU utilization, as it can vary depending on the specific use case and system requirements. However, I can provide some general guidelines.

In a typical desktop or laptop scenario, a CPU utilization below 70-80% is often considered normal for everyday tasks. This allows the system to have some headroom for spikes in usage and ensures a responsive user experience.

For servers or systems running resource-intensive applications, a higher CPU utilization may be acceptable. In these cases, as long as the CPU doesn't consistently operate at 100% and cause performance issues, it might be considered in good condition.

It's important to note that CPU utilization alone doesn't tell the whole story. The overall system performance and responsiveness depend on factors like the efficiency of the underlying architecture, the nature of the tasks being performed, and the presence of other bottlenecks such as insufficient RAM or slow storage.

Memory

Similar to CPU utilization, there isn't a universal threshold for memory (RAM) utilization that applies to all scenarios. The acceptable memory usage depends on the specific use case, the total amount of installed RAM, and the requirements of the applications running on the system.

For typical desktop or laptop use, a system may be in good condition with memory usage below 70-80%. This allows for some headroom for the operating system and applications.

Systems running memory-intensive applications like video editing, 3D rendering, or virtual machines may have higher memory utilization, potentially nearing or reaching 100%. As long as the system is not constantly swapping to disk (which can significantly slow down performance), high memory usage might be acceptable in these cases.

Servers handling multiple concurrent users or services may have higher memory usage, and administrators often monitor for potential bottlenecks. The threshold for acceptable memory usage in server environments can vary widely based on the specific server role and requirements.

Wednesday, December 06, 2023

How To Disable CA Service Desk Manager PDA Interface

To disable the CA Service Desk Manager PDA interface, you can follow these steps:

  • From the CA Service Desk Manager Server, open NX_ROOT\bopcfg\www\htmpl\pda (C:\Program Files (x86)\CA\Service Desk Manager\bopcfg\www\htmpl\pda) Rename or move all folders in that folder
  • Copy all folder (analyst, customer, employee) from C:\Program Files (x86)\CA\Service Desk Manager\bopcfg\www\htmpl\web\ and paste to C:\Program Files (x86)\CA\Service Desk Manager\bopcfg\www\htmpl\pda
  • If you have previously customized the form group, then copy the entire folder in C:\Program Files (x86)\CA\Service Desk Manager\site\mods\www\htmpl\web into the C:\Program Files (x86) folder \CA\Service Desk Manager\site\mods\www\htmpl\pda
  • Delete the web cache by running the command pdm_webcache -H
  • Done


How to find out CA Service Desk manager version?

Here are several ways to find out which version of CA Service Desk Manager is installed.
1. Web Interface. Login to the ServiceDesk Web Interface -> Select Help Menu -> About. This will display the ServiceDesk Build version.
Release: 17.3
Version: 'hyd-368'


2. Version File. From ServiceDesk Server, open the "version" file located under $NX_ROOT/pdmconf folder. Example:
Version 17.3 ( hyd-368 2020-03-20T21:16:19 )

3. GENLEVEL File. From ServiceDesk Server, Open the GENLEVEL file located under the $NX_ROOT/ folder. Example:
17017023G900

4. .HIS File. From ServiceDesk Server, Open the GENLEVEL file located under the $NX_ROOT/ folder.  .HIS file. Example:
RELEASE=17.1
GENLEVEL=0000

Tuesday, December 05, 2023

Upgrade CA SDM r17.1 to 17.3

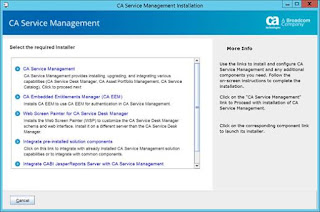
  1. On CASDM server mount “CA Service Desk Manager 17.3 for Windows” ISO (DVD0000000002102.iso)
  2. Browse the CD and right click on Setup.exe and select "Run as administrator"
  3. Select the language and click "Next"
  4. Select "CA Service Management"
  5. Review and Accept the License Agreement Information and click "Next"
  6. Select Microsoft SQL Server as the database type in the Database Configuration screen. Provide the database details:
    • Database Server: CADB
    • Database Name: mdb
    • Database Port: 1433
    • Database Server Instance:
    • Database Admin User: sa
    • Database Admin Password: Enter the database password of the user specified by a database admin user
    • Mdbadmin Password: Enter the password for the user specified for the MDB admin user
    • Confirm mdbadmin Password: Confirm the password.
    • Click "Next".
  7. Click "Next"

  8. Select product integration, and click "Next"
  9. Complete Telemetry Service Setting, and click "Save & Close" and click "Next"
  10. On Installation Prerequisites screen, click "Next"
  11. Complete and review xFlow Analyst Interface Configuration detail, and click "Next"
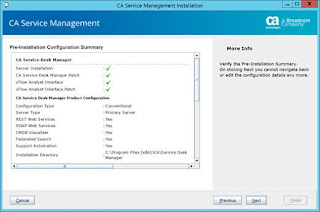
  12. On Pre-installation Configuration summary, click "Next"

  13. On pop-up alert post-install step confirmation, click "Yes"
  14. Click "Install" to start installation


  15. After installation complete, click "Next"

  16. On Post Deployment Summary screen, click "Finish"

Upgrade SQL 2008 to SQL 2016

Follow this step to upgrade SQL Server 2008 to SQL 2016.

1.      Insert the SQL Server installation media. From the root folder, double-click setup.exe

Upgrade SQL 2008 to SQL 2016 - 1


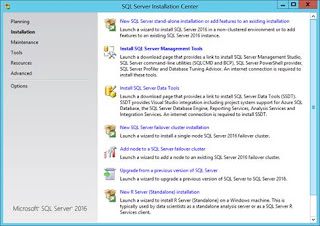
2.      The SQL Server Installation Center will begin. Select Installation from the left menu, and then click Upgrade from a previous SQL Server

Upgrade SQL 2008 to SQL 2016 - 2


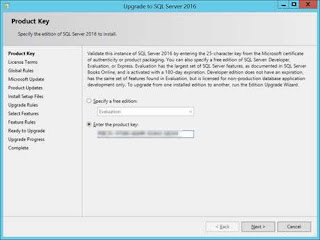
3.      Then you’ll have to indicate whether you’re upgrading to a free edition of SQL server or you have a PID key for the production version.


Upgrade SQL 2008 to SQL 2016 - 3

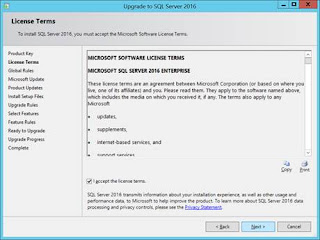
4.      Read the license terms and conditions carefully. Select I accept the agreement and click Next

Upgrade SQL 2008 to SQL 2016 - 4


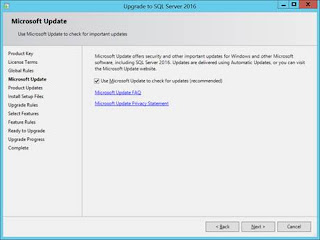
5.      Check the box for Use Microsoft Update to check for updates (recommended) and click Next

Upgrade SQL 2008 to SQL 2016 - 5


6.      On product update screen, click Next

Upgrade SQL 2008 to SQL 2016 - 6


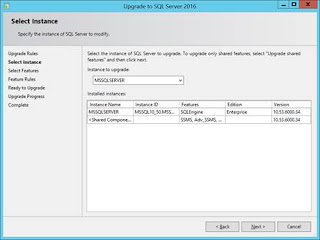
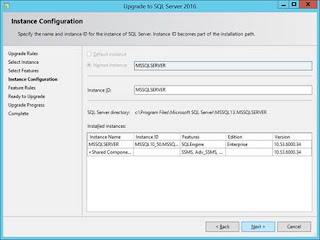
7.      On the Select Instance page, Click Next

Upgrade SQL 2008 to SQL 2016 - 7


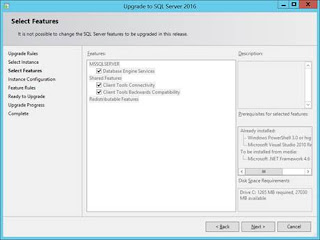
8.      On the Feature Selection page, click Next

Upgrade SQL 2008 to SQL 2016 - 8


9.      On the Select Instance page, click Next

Upgrade SQL 2008 to SQL 2016 - 9


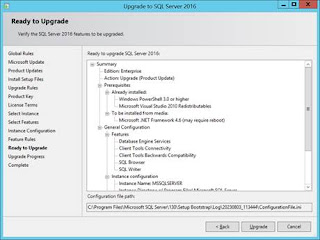
10.   Proceed with the rest of the steps and hit Upgrade.

Upgrade SQL 2008 to SQL 2016 - 10

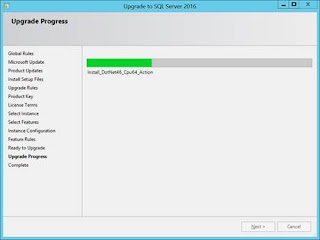
Upgrade SQL 2008 to SQL 2016 - 11

11.   On pop-up computer restart required notification, click OK

Upgrade SQL 2008 to SQL 2016 - 12


12.   On complete screen, click Close

Upgrade SQL 2008 to SQL 2016 - 13


Restart